A practical guide to identifying, diagnosing, and resolving performance degradation in Spring Boot applications running on Kubernetes.
Introduction
In a previous post, I talked about building my own OIDC Identity Provider from scratch — because using Keycloak like a normal person was apparently too easy.
I deployed the first version to my cluster, opened the login page, typed in my credentials, hit Enter, and… nothing. The page froze. Not just the IDP — everything froze. Other services on the cluster? Gone. The Kubernetes control plane? Also gone. I had built a login form that doubled as a denial-of-service attack against my own infrastructure.
This post walks through how I diagnosed what went wrong, the tools I used, and how you can do the same when your application decides to take the entire neighborhood down with it.
Symptoms
Here’s what “not working as expected” actually looked like:
- User clicks “Log in” → browser spinner of doom, indefinitely
- The IDP pod stops responding to health checks
- Other services on the same cluster start timing out
kubectlcommands hang — the control plane is choking
After a while things recovered on their own, but getting locked out of the cluster without any useful information to show for it wasn’t exactly a great developer experience.
Environment
| Component | Details |
|---|---|
| Java version | 25 (GraalJDK) |
| Spring Boot | 3.5.6 |
| Build tool | Gradle |
| Container | Docker |
| Orchestration | Kubernetes (single node) |
| Database | PostgreSQL |
| Observability | Prometheus + Grafana |
Initial Assumptions
Before reaching for any tooling, I tried to think through what could cause this. It’s just a single-node demo cluster so uptime isn’t a real concern, but still — a login form shouldn’t be able to do this.
- Database meltdown — Is the login flow hammering Postgres? N+1 selects on the user table? A full table scan on every authentication attempt?
- Thread starvation — Am I blocking every thread in the pool with some synchronous call that’s waiting on something that’s waiting on something that’s waiting on…
- Memory explosion — Is the JVM eating all available memory and triggering a GC death spiral?
- Resource limits (or lack thereof) — Is my IDP just consuming the entire node? And what could possibly be so expensive about a login?
- Something profoundly stupid — Statistically the most likely option.
Never optimize before measuring though. Instead of acting on gut feeling, I wanted actual data first.
Investigation
Step 1: Check the Basics (If You Still Can)
Normally I’d say “start with the logs,” but half my tooling was also down because — again — I took out the control plane. So step one was actually an infrastructure change: move the control plane to its own dedicated node, add a second node for workloads, and taint the control plane node so nothing else gets scheduled on it. This is what I should have done from the start.
With that in place, I could at least reproduce the issue and still interact with the cluster while it was happening.
Application logs — Checked for warnings, slow query logs, connection timeouts. Nothing. Completely clean. No errors, no warnings, no clues.
Kubernetes events — kubectl describe pod showed no OOMKilled events, no restart loops, nothing suspicious. The pod was technically still “Running,” just not doing anything useful.
# Check pod status and events
kubectl describe pod <idp-pod-name>

# Look for OOMKilled or other issues
kubectl get events --sort-by='.lastTimestamp'
So the basics gave me nothing. On to the real tools.
Step 2: Actuator — Your Best Friend in Spring Boot
Spring Boot Actuator exposes runtime information through endpoints like /actuator/health, /actuator/metrics, and /actuator/prometheus. If you haven’t enabled these, you’re debugging blind.
Worth noting for production: Actuator endpoints can expose sensitive internal data, so you don’t want them publicly accessible. The cleanest approach is to serve them on a separate management port. In Kubernetes, you can then create an internal ClusterIP Service that Prometheus scrapes, and nothing gets exposed externally.
# application.yml - Spring Boot
management:
  server:
    port: 9090
  endpoints:
    web:
      exposure:
        include: health, prometheus, metrics, threaddump
  endpoint:
    health:
      show-details: when-authorized
# Kubernetes Service for metrics scraping only
apiVersion: v1
kind: Service
metadata:
name: idp-metrics
labels:
app: idp
annotations:
prometheus.io/scrape: "true"
prometheus.io/port: "9090"
prometheus.io/path: "/actuator/prometheus"
spec:
type: ClusterIP
selector:
app: idp
ports:
- name: management
port: 9090
targetPort: 9090Application port serves traffic, management port serves observability. Nothing leaks out.
Step 3: Look at the Data
With Actuator metrics flowing into Prometheus and visualized in Grafana, I could finally see what was actually going on during the login attempt.
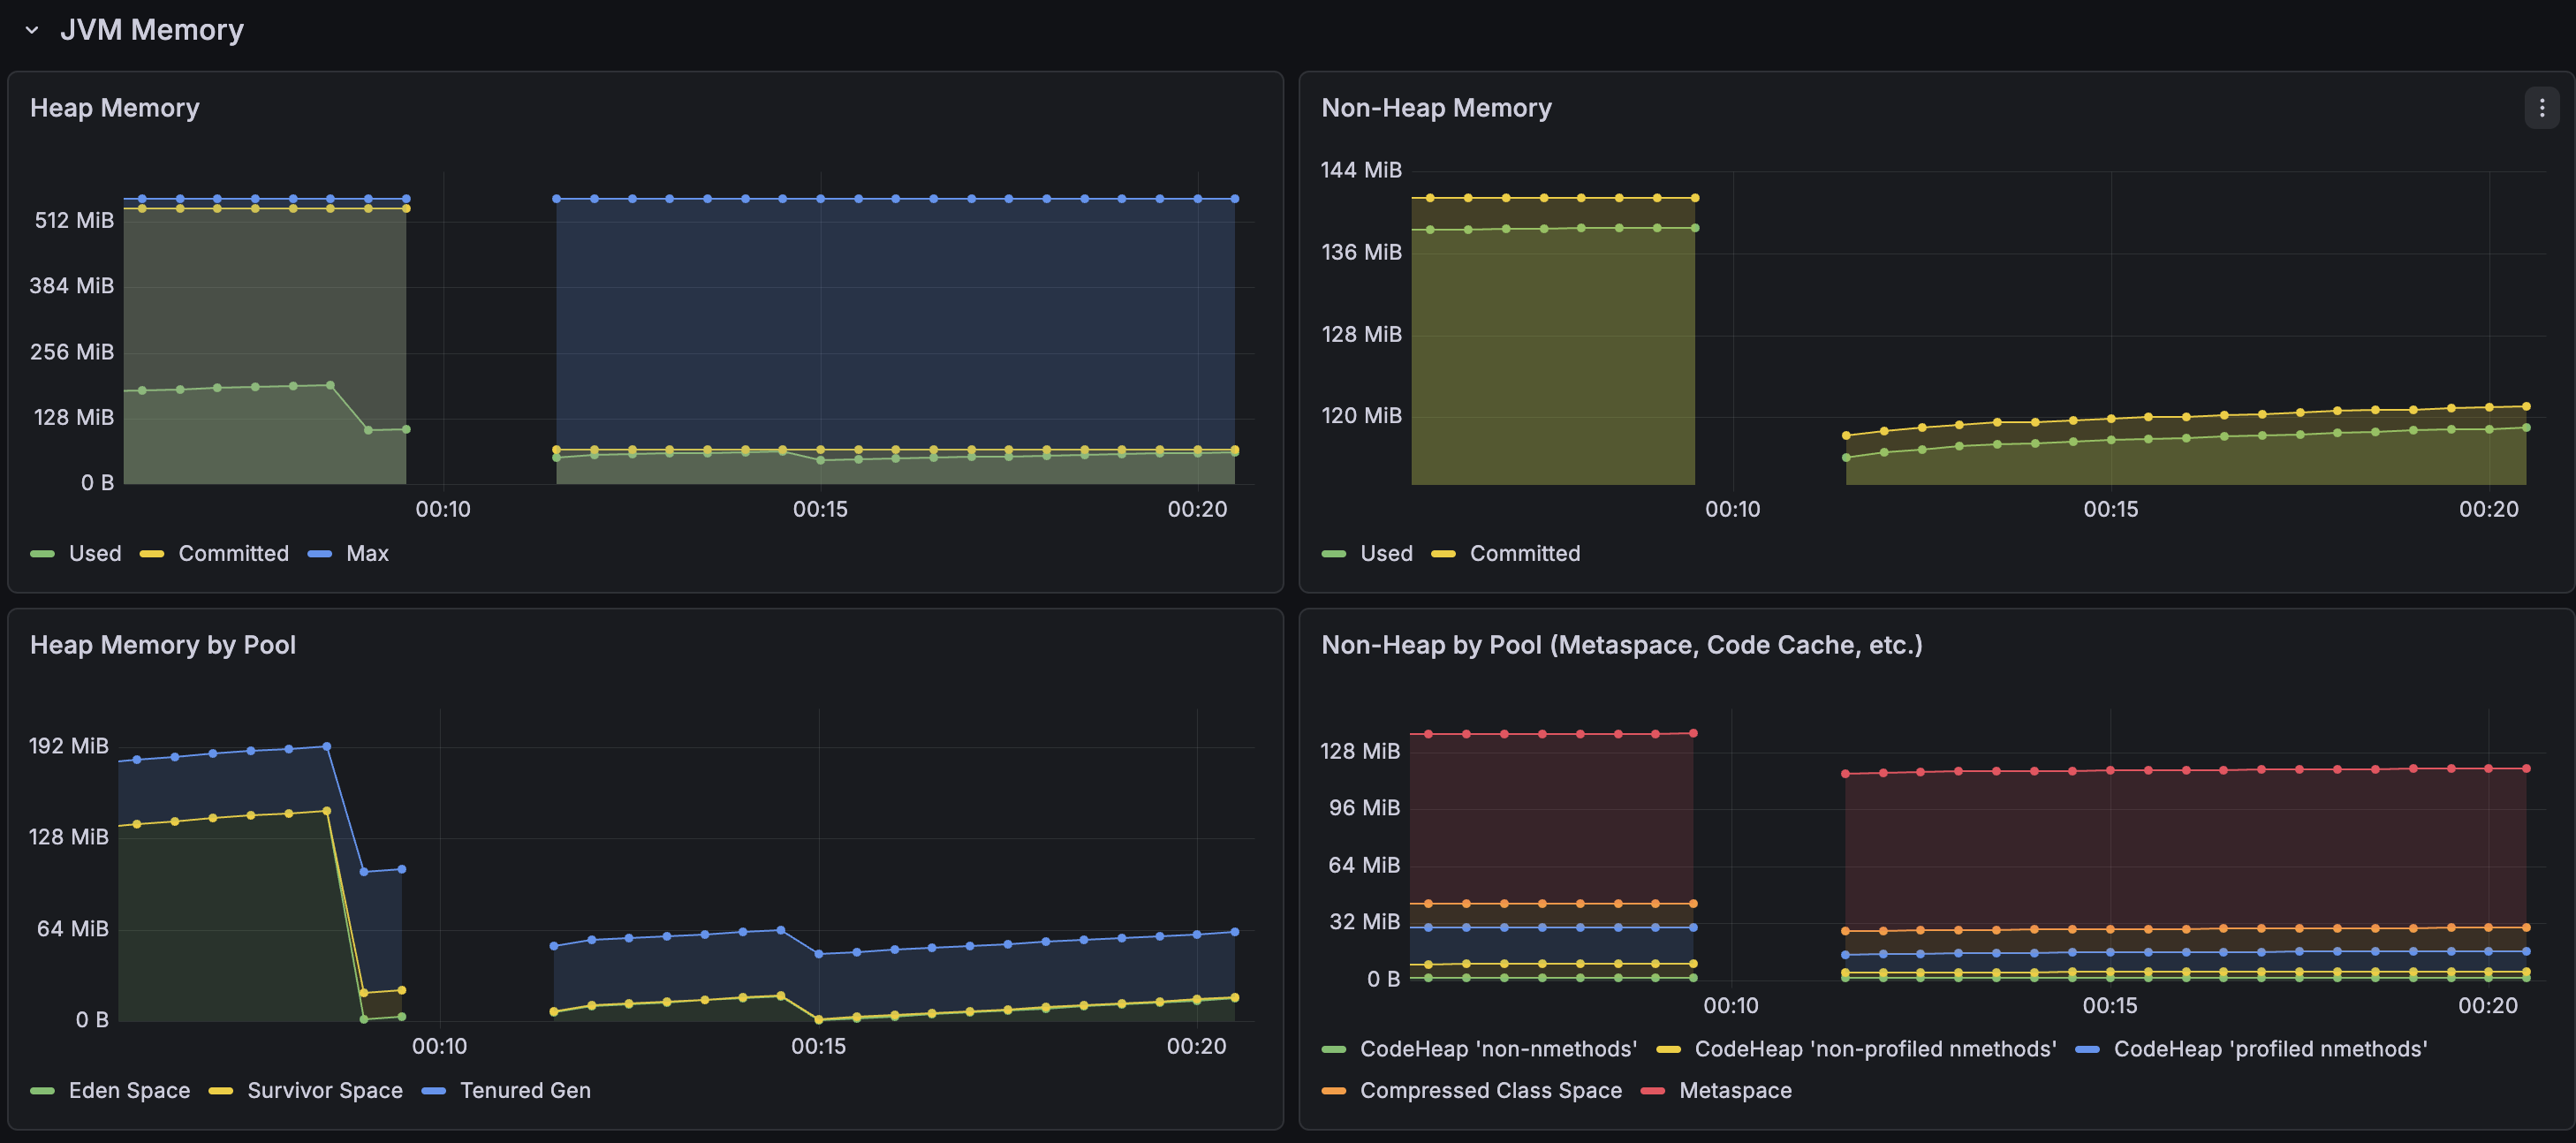
Memory was relatively stable during the incident — never hit the maximum heap space. It’s using more memory than you’d expect for a login service, which is worth looking into later, but it wasn’t the bottleneck.
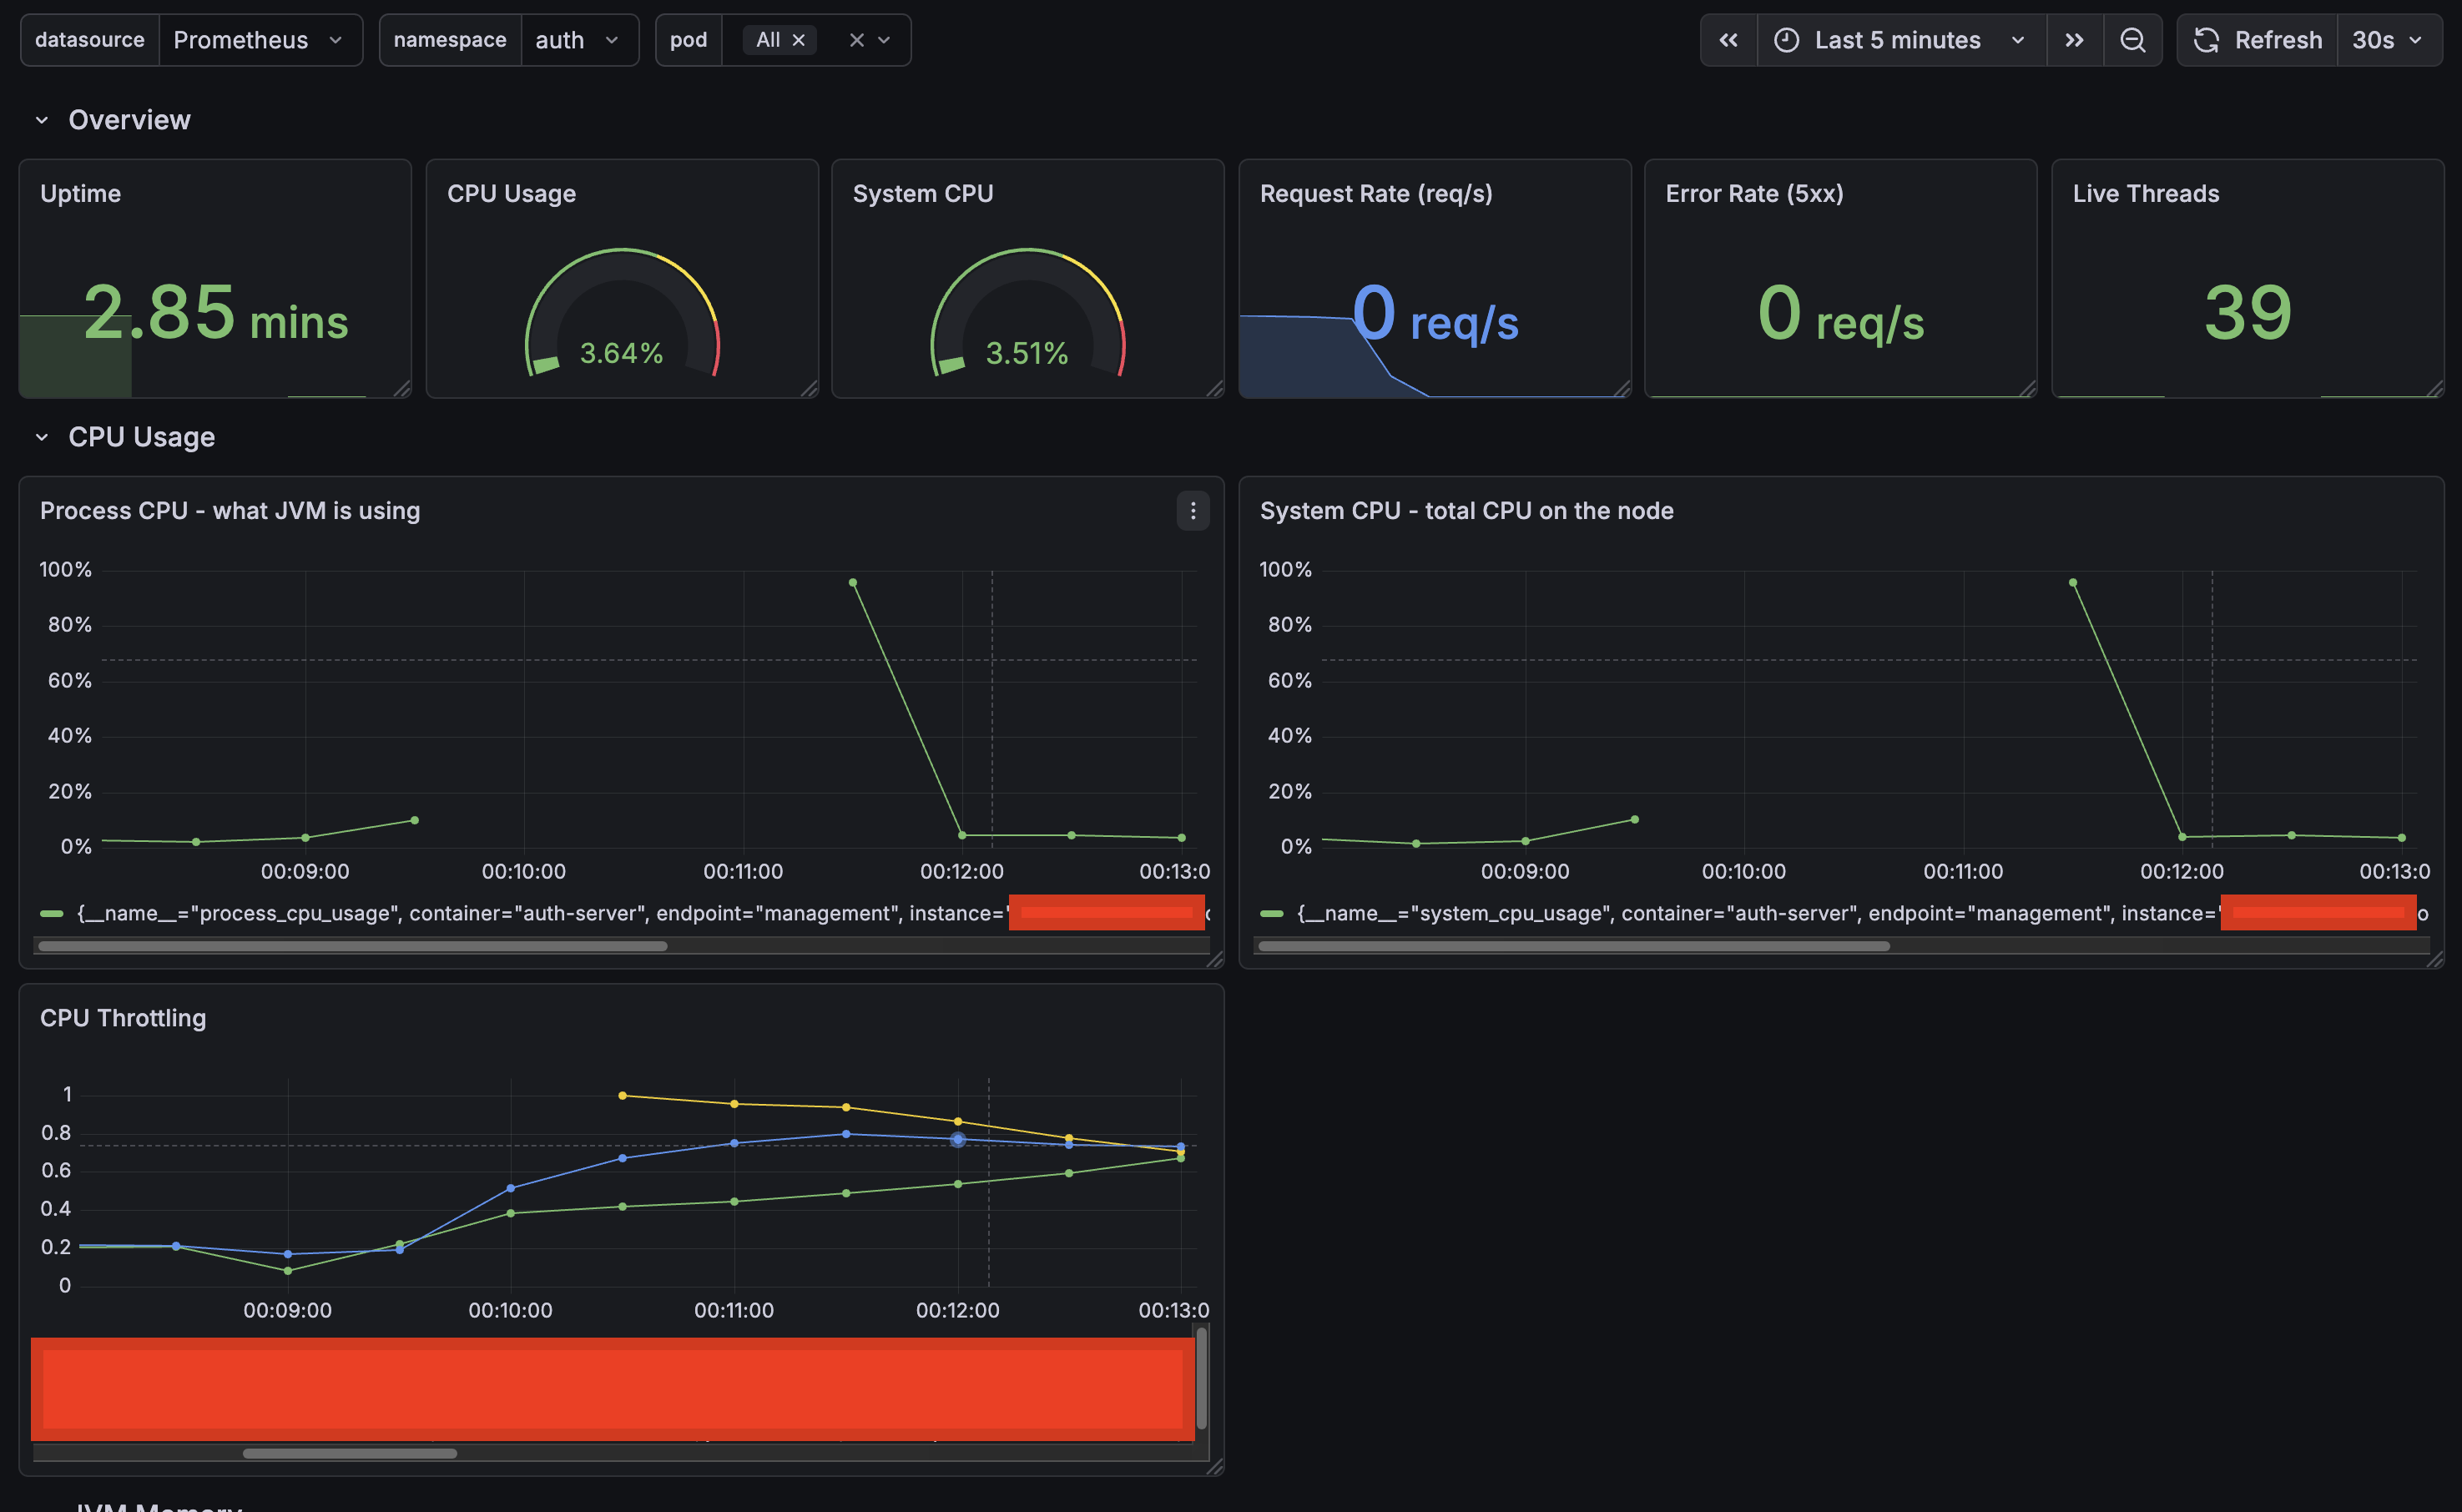
CPU told a completely different story. The moment a login request came in, CPU spiked so hard the application became unresponsive — you can see the gap in the graph where Prometheus couldn’t even scrape metrics anymore. The throttling metrics went through the roof. The container was hitting its CPU limit and getting aggressively throttled by the kernel.
Not I/O-bound, not memory-bound — pure compute. On a single-node cluster, that’s enough to starve everything else on the node, including kubelet and the control plane.
Now the question was: what is my login endpoint doing that requires this much CPU? It should load a user, validate the password, and mint some tokens. None of that should be melting a server.
Step 4: Profiling — What Is the Application Actually Doing?
I know something in the login flow is burning all available CPU. Logs won’t tell me what, and I’ve been staring at the code long enough. Time to profile.
IntelliJ has a built-in profiler that makes this pretty painless — start the application with the profiler attached, do the thing, stop the profiler, look at the results.
- Run the application from IntelliJ with the profiler enabled (Run → Profile)
- Open the login page and submit credentials
- Wait for the request to complete
- Stop the profiler and open the flame graph
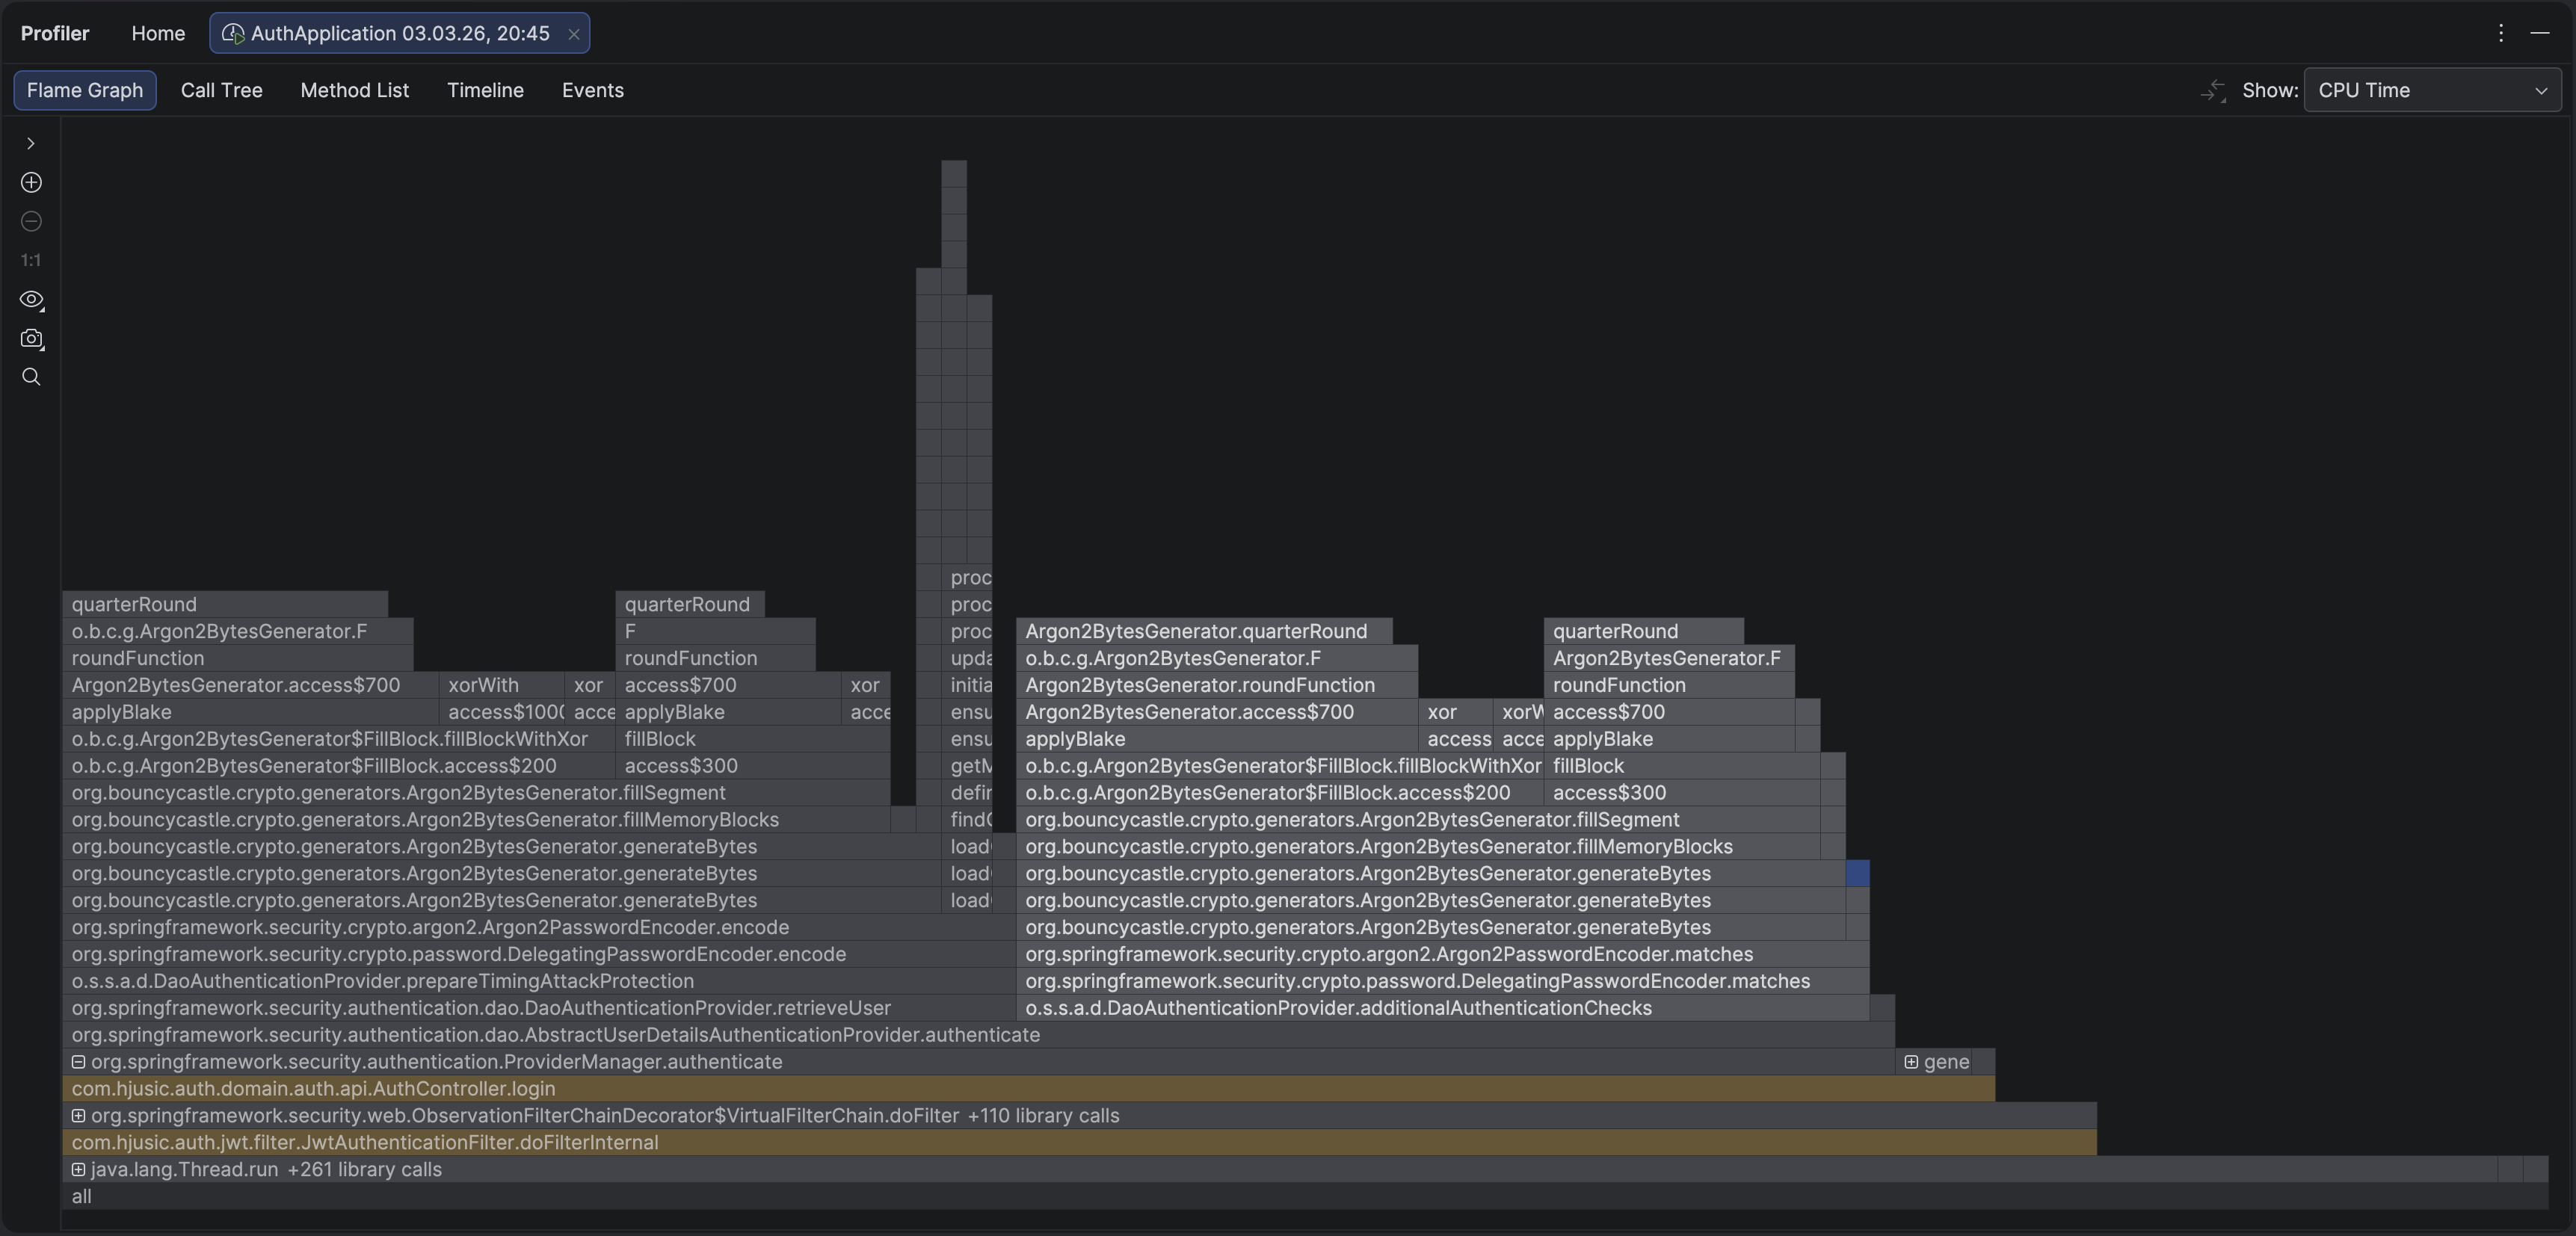
Immediately obvious. The overwhelming majority of CPU time was spent inside two method calls — and neither was anything I wrote. The entire flame graph was dominated by Argon2PasswordEncoder.encode() and Argon2PasswordEncoder.matches().
matches() makes sense — that’s the password verification. But encode()? Why is Spring hashing a password during authentication?
Turns out Spring’s DaoAuthenticationProvider calls encode() on a dummy value as a timing attack mitigation. If a user doesn’t exist, it still performs a hash so the response time looks the same as a real login. Which is actually really smart — and the kind of thing you’d never notice until it shows up in a flame graph. But it means every login triggers two full Argon2 computations instead of one.
Now, Argon2 is a memory-hard password hashing algorithm. It’s supposed to be expensive — that’s the entire point. Making each hash slow and resource-intensive is what makes brute-force attacks impractical. But “slow and resource-intensive” means very different things on a dedicated auth server with 16 cores versus a small Kubernetes pod on a single-node demo cluster.
My configuration:
int memory = 65536;   // 64 MB of memory per hash
int iterations = 3;   // 3 passes over that memory
int parallelism = 1;  // single-threaded
So every login was triggering two computations, each churning through 64 MB of memory three times, sequentially, on one thread. On a resource-constrained pod, that’s enough to peg the CPU for several seconds and starve the entire node.
Is This Configuration Actually Wrong?
Not really. And that’s the interesting part.
Argon2 won the 2015 Password Hashing Competition and is widely considered the best option for hashing passwords today. A memory-hard algorithm that requires significant memory and CPU per hash makes it extremely expensive for an attacker to try millions of combinations. That’s the whole idea.
My parameters (64 MB memory, 3 iterations, parallelism of 1) are pretty standard for a production auth server. The problem wasn’t the configuration — it was the environment. A single-node cluster with tight resource limits is just not the place to run expensive cryptographic operations without thinking about cost.
OWASP’s Password Storage Cheat Sheet recommends Argon2id as the first choice and provides these guidelines:
| Parameter | OWASP Minimum | My Configuration |
|---|---|---|
| Memory | 19 MiB (19456 KB) | 64 MiB (65536 KB) |
| Iterations | 2 | 3 |
| Parallelism | 1 | 1 |
| Hash length | 32 bytes | 32 bytes |
| Salt length | 16 bytes | 16 bytes |
Their general advice: use the maximum parameters your environment can tolerate, tuned so a login takes roughly 0.5–1 second on your hardware. Key word being your hardware. What feels instant on a 12-core MacBook Pro with 32 GB of RAM might be catastrophic on a pod with 500m CPU and 512 MiB of memory.
The fix isn’t to ditch Argon2 for something weaker. It’s to tune the parameters for where your code actually runs, and make sure the infrastructure can handle the cost of a single authentication without falling over.
After some experimentation I landed on values that keep login times under a second on my cluster without starving the node. The right numbers will depend on your hardware — the point is to measure, not to guess.
What I Learned
This was a login form. One endpoint, one user, one request. It brought down an entire cluster. And the root cause wasn’t really a bug — it was a mismatch between a perfectly reasonable security configuration and the environment it was running in.
Some things I’ll do differently going forward:
Measure first. My initial guesses included database issues, thread starvation, and memory leaks. The actual cause — CPU saturation from password hashing — wasn’t on the list. Without metrics and a profiler, I’d have wasted hours going down the wrong path.
Test on something that resembles production. Argon2 with 64 MB and 3 iterations feels instant on a laptop. On a constrained pod, it’s a self-inflicted denial-of-service.
Set up observability before you need it. Actuator, Prometheus, and Grafana gave me the graphs that actually pointed somewhere. Without them, all I had was clean logs and a pod that was technically “Running.” You can’t set this stuff up while everything is on fire.
Read the source of your dependencies. Spring running a dummy hash for timing attack prevention is good security design. It also means every login costs two Argon2 computations, not one. Can’t tune what you don’t know about.
Keep workloads off the control plane. Running everything on one node is fine for a quick demo — right up until something misbehaves and you can’t even kubectl your way into diagnosing it. Taint the control plane node. Future you will appreciate it.